


Free shipping on orders over $99


Features
3D Graph
3D graph types
Four types of 3D graphs (Sphere,Cylinder,Plane and Line) are available. It is easy to draw 3D graphs using templates.(An industry-first feature)
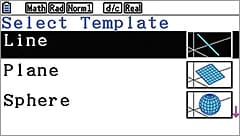
Template
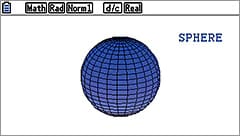
Sphere
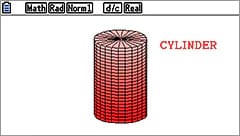
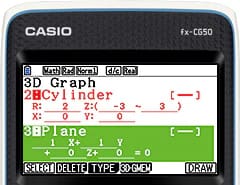
Cylinder
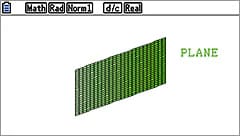
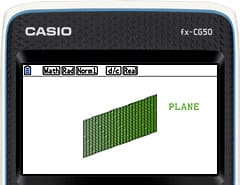
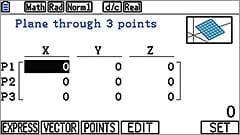
Plane
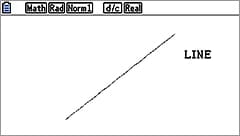
Line
Draw and display up to three 3D graphs
Recognize combinations of graphs and interactive relationships between two or three graphs mathematically.
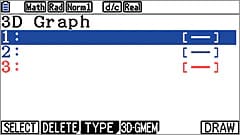
Three expressions available
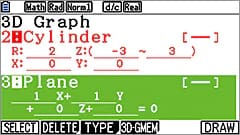
Cylinder and plane expressions
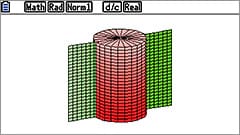
Cylinder and plane graphs
Investigate the relationship between expressions and 3D graphs
Expression
3D graph
Select EXPRESS, VECTOR or POINTS format when in putting expression of 3D graphs.
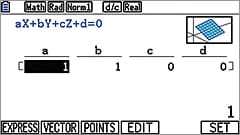
EXPRESS
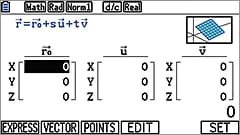
VECTOR FORMAT
POINTS FORMAT
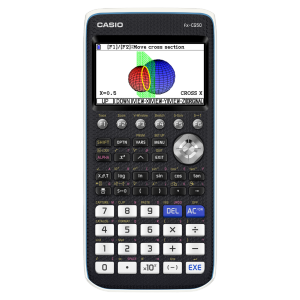
Explore 3D graphs mathematically
① Zoom in and zoom out
Zoom in
Zoom out
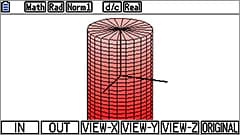
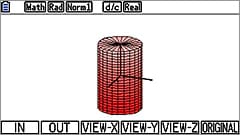
② Vertical and horizontal rotation
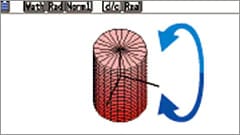
Vertical rotation
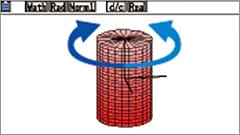
Horizontal rotation
③ Cross section
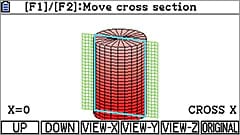
Cross section
④ X-axis,Y-axis, Z-axis view
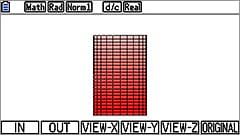
X-axis view
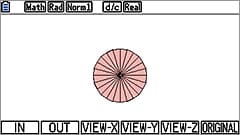
Z-axis view
Basic Functions
• Angle unit, Angle unit conversion (Deg, Rad, Gra)
• Trigonometric functions, Inverse trigonometric functions
• Hyperbolic functions, Inverse hyperbolic functions
• Exponent functions, Logarithmic functions
• Power functions (square root, cubic root, square, power, radical root)
• Coordinate conversion (Pol, Rec)
• Combination/Permutation (nCr, nPr)
• Factorial, Inverse, Random numbers, Random sampling of an existing list, Fractions
• Logical operations
• Sexagesimal ↔ Decimal conversion
• Matrix calculations
• Vector calculations
• Complex number calculations
• Base-n calculations/conversions
• List data calculations
• Rounding
• Display format
• Conversion (pre-installed software)
• Engineering symbol calculation
• Engineering notation
• Spreadsheet
• Probability Simulation
Graphing
• 3D Graph (pre-installed software)
• Rectangular coordinate graphing,Polar coordinate graphing
• Integration graph
• Parametric function graphing, Inequality graphing
• Trace, Zoom (box zoom, zoom in, zoom out, auto zoom)
• Table and Graph
• Dual Graph (table and graph, graph and graph)
• Sketch (tangent line, normal line, inverse function)
• Solve (root, minimum, maximum, intersection, integration: integral calculation improvement (real-time integral calculation), new integral calculation function (mixed integrals))
• Dynamic graph
• Conic section graph
• Recursion graph
• Picture Plot (pre-installed software)
Statistics
• List-based one-variable and two-variable statistical analysis
• Statistical regression calculations
• Statistical plot (scatter plot, xyLine, normal probability plot, histogram, box plot)
• Statistical regression graphs (linear, med-med, quadratic, cubic, quartic, logarithmic, exponential, power, sinusoidal, logistic regression)
• Advanced statistical calculations: tests (Z-test, t-test, χ²-test, F-test, ANOVA), intervals (Z-interval, t-interval), distributions
• Pie chart
• Bar graph
Hardware
• Power supply : Four AAA-size alkaline batteries or four nickel-metal hydride batteries
• Approximate battery life (hours) : 140 (AAA-size alkaline batteries), 85 (nickel-metal hydride batteries) Assuming 5 minutes calculation and 55 minutes display per hour
• Dot matrix display : 216 x 384 dots
• Display capacity (characters) : 21 x 8
• Internal operation digits : 15
• Nested parentheses levels : 26
• Data communication : 3-pin cable, USB cable
• 3-pin serial port
• USB port