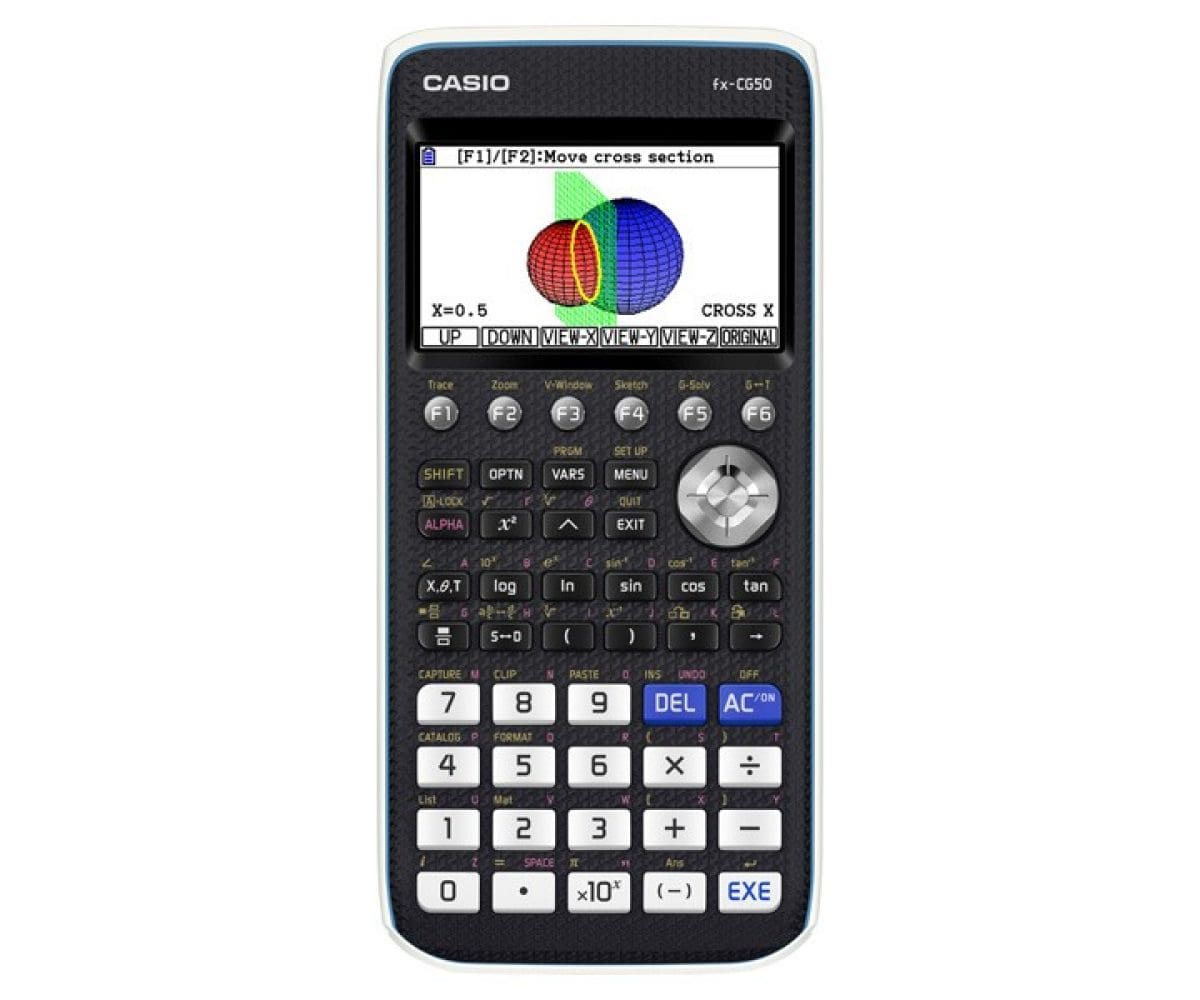
FX-CG50


Free Standard Delivery
For orders over £50
Secure Payment


Use code BTS20 for 20% off selected lines - Sale price £111.99 The fx-CG50 has now been replaced by the fx-CG100, as the UK’s best-selling graphic calculator. • Approved for use in Key stages 3, 4 and 5 and can be used for GCSE Advanced/Further Maths, A Level Mathematics, Highers, Advanced Highers and IB (all levels). • Allowed in every UK exam where a calculator can be used. • Free UK delivery • Free 3 year guarantee included • Slide-on protective hard cover included • Permitted in all UK calculator exams Other models to consider: If you are studying Further maths, A-Level Maths, Scottish Highers/Advanced Highers or IB (all levels) , we recommend the fx-CG100 Graphic Calculator, our most powerful and advanced calculator. Reliable and Durable: Built for Learning. Made to Last. Cheap alternatives and counterfeit copies may be available, but they often lack the reliability, durability, and curriculum suitability needed for classroom use. Our genuine calculators are built to last, trusted by educators, and suitable for the UK maths curriculum. For the best performance and long-term value, we recommend choosing an authentic Casio product. From the inventors the world’s first compact all-electric calculator over 60 years ago, genuine Casio calculators offer the durability, reliability, and UK curriculum compatibility that students and teachers depend on. Choose authentic for quality you can trust. Avoid counterfeit and fake products. Buy with confidence from a trusted source View our Model Comparison Chart to find the right calculator for you. The fx-CG50 is permitted in all UK calculator exams, further details can be found on the Joint Council for Qualifications calculator FAQ document here .
Features
3D Graph
3D graph types
Four types of 3D graphs (Sphere, Cylinder, Plane and Line) are available. It is easy to draw 3D graphs using templates.(An industry-first feature)
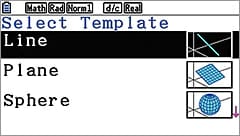
Template
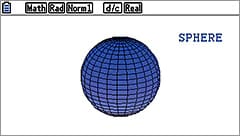
Sphere
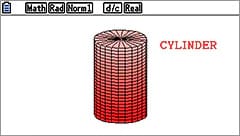
Cylinder
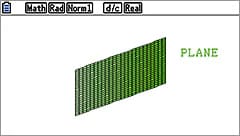
Plane
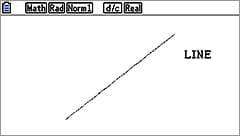
Line
Draw and display up to three 3D graphs
Recognise combinations of graphs and interactive relationships between two or three graphs mathematically.
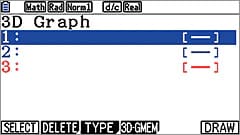
Three expressions available
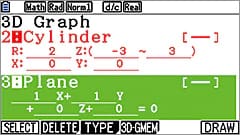
Cylinder and plane expressions
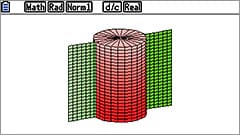
Cylinder and plane graphs
Investigate the relationship between expressions and 3D graphs
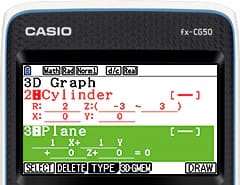
Expression
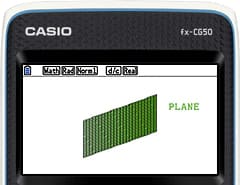
3D graph
Select EXPRESS, VECTOR or POINTS format when in putting expression of 3D graphs.
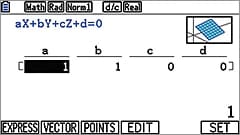
EXPRESS
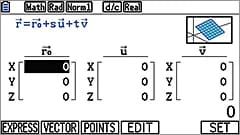
VECTOR FORMAT
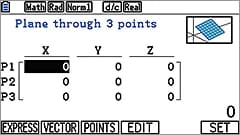
POINTS FORMAT
Explore 3D graphs mathematically
(1) Zoom in and zoom out
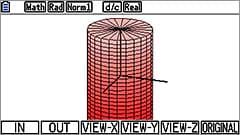
Zoom in
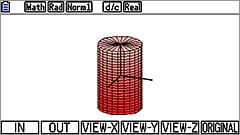
Zoom out
(2) Vertical and horizontal rotation
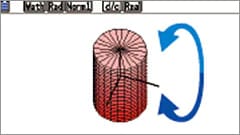
Vertical rotation
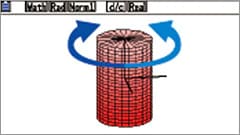
Horizontal rotation
(3) Cross section
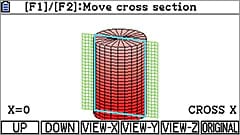
Cross section
(4) X-axis, Y-axis, Z-axis view
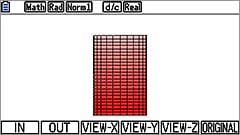
X-axis view
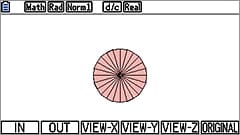
Z-axis view
Basic Functions
• Angle unit, Angle unit conversion (Deg, Rad, Gra)
• Trigonometric functions, Inverse trigonometric functions
• Hyperbolic functions, Inverse hyperbolic functions
• Exponent functions, Logarithmic functions
• Power functions (square root, cubic root, square, power, radical root)
• Coordinate conversion (Pol, Rec)
• Combination/Permutation (nCr, nPr)
• Factorial, Inverse, Random numbers, Random sampling of an existing list, Fractions
• Logical operations
• Sexagesimal ↔ Decimal conversion
• Matrix calculations
• Vector calculations
• Complex number calculations
• Base-n calculations/conversions
• List data calculations
• Rounding
• Display format
• Conversion (pre-installed software)
• Engineering symbol calculation
• Engineering notation
Graphing
• 3D Graph (pre-installed software)
• Rectangular coordinate graphing, Polar coordinate graphing
• Integration graph
• Parametric function graphing, Inequality graphing
• Trace, Zoom (box zoom, zoom in, zoom out, auto zoom)
• Table and Graph
• Dual Graph (table and graph, graph and graph)
• Sketch (tangent line, normal line, inverse function)
• Solve (root, minimum, maximum, intersection, integration: integral calculation improvement (real-time integral calculation), new integral calculation function (mixed integrals))
• Dynamic graph
• Conic section graph
• Recursion graph
• Picture Plot (pre-installed software)
Statistics
• List-based one-variable and two-variable statistical analysis
• Statistical regression calculations
• Statistical plot (scatter plot, xyLine, normal probability plot, histogram, box plot)
• Statistical regression graphs (linear, med-med, quadratic, cubic, quartic, logarithmic, exponential, power, sinusoidal, logistic regression)
• Advanced statistical calculations: tests (Z-test, t-test, χ²-test, F-test, ANOVA), intervals (Z-interval, t-interval), distributions
• Pie chart
• Bar graph
Hardware
• Power supply: Four AAA-size alkaline batteries or four nickel-metal hydride batteries
• Approximate battery life (hours): 140 (AAA-size alkaline batteries), 85 (nickel-metal hydride batteries) Assuming 5 minutes calculation and 55 minutes display per hour
• Dot matrix display: 216 x 384 dots
• Display capacity (characters): 21 x 8
• Internal operation digits: 15
• Nested parentheses levels: 26
• Data communication: 3-pin cable, USB cable
• 3-pin serial port
• USB port